Ben and I took a shot at the FiveThirtyEight Thanksgiving puzzle.
coauthor: Ben Gould
Problem
Consider a Thanksgiving celebration with you and 19 of your family members seated at a circular table (socially distanced, of course). Everyone at the table would like a helping of cranberry sauce, which happens to be in front of you at the moment. Instead of passing the sauce around in a circle, you pass it randomly to the person seated directly to your left or to your right. They then do the same, passing it randomly either to the person to their left or right. This continues until everyone has, at some point, received the cranberry sauce. Of the 20 people in the circle, who has the greatest chance of being the last to receive the cranberry sauce?
Solution
Consider a table with four seats. Numbering the seats as 0 for the starting position, and 1, 2, 3 as the other positions, the cranberry sauce is initially passed to either seat 1 or 3. Note that if 3 of 4 seats have received the cranberry sauce, we know which seat gets the sauce last and do not need to consider future iterations of that state. We will consider these cases resolved, allowing us to simplify the problem and generate a concise chart outlining all of the possible iterations, shading the circles as they are resolved:
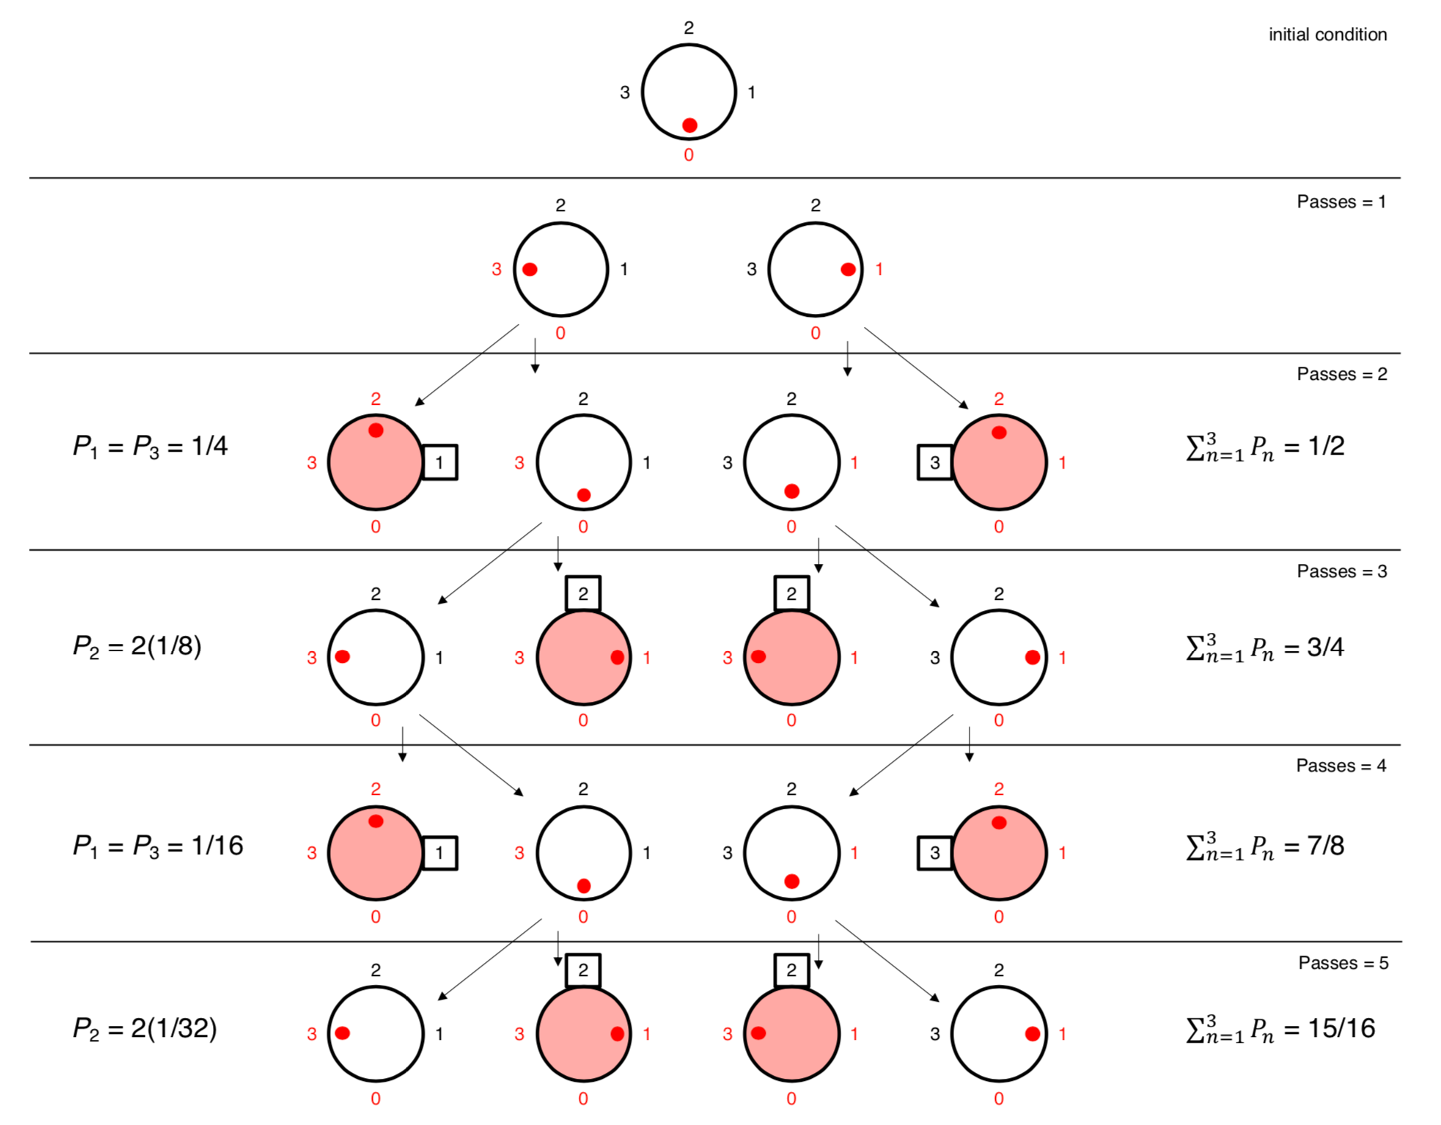
As we determine the last seat to receive the sauce, we assign a probability to that state (Pn). Summing the probabilities yields the following table, which examines the likelyhood a given seat will be the last to receive the sauce after a number of passes.
| Passes | 1 | 2 | 3 | Probability resolved |
|---|---|---|---|---|
| 2 | 1/4 | 1/4 | 1/2 | |
| 3 | 2/8 | 3/4 | ||
| 4 | 1/16 | 1/16 | 7/8 | |
| 5 | 2/16 | 15/16 | ||
| 6 | 1/64 | 1/64 | 31/32 | |
| 7 | 2/64 | 63/64 | ||
| 8 | 1/256 | 1/256 | 127/128 | |
| 9 | 2/256 | 255/256 |
The sum of all three columns are equal, and take the form:
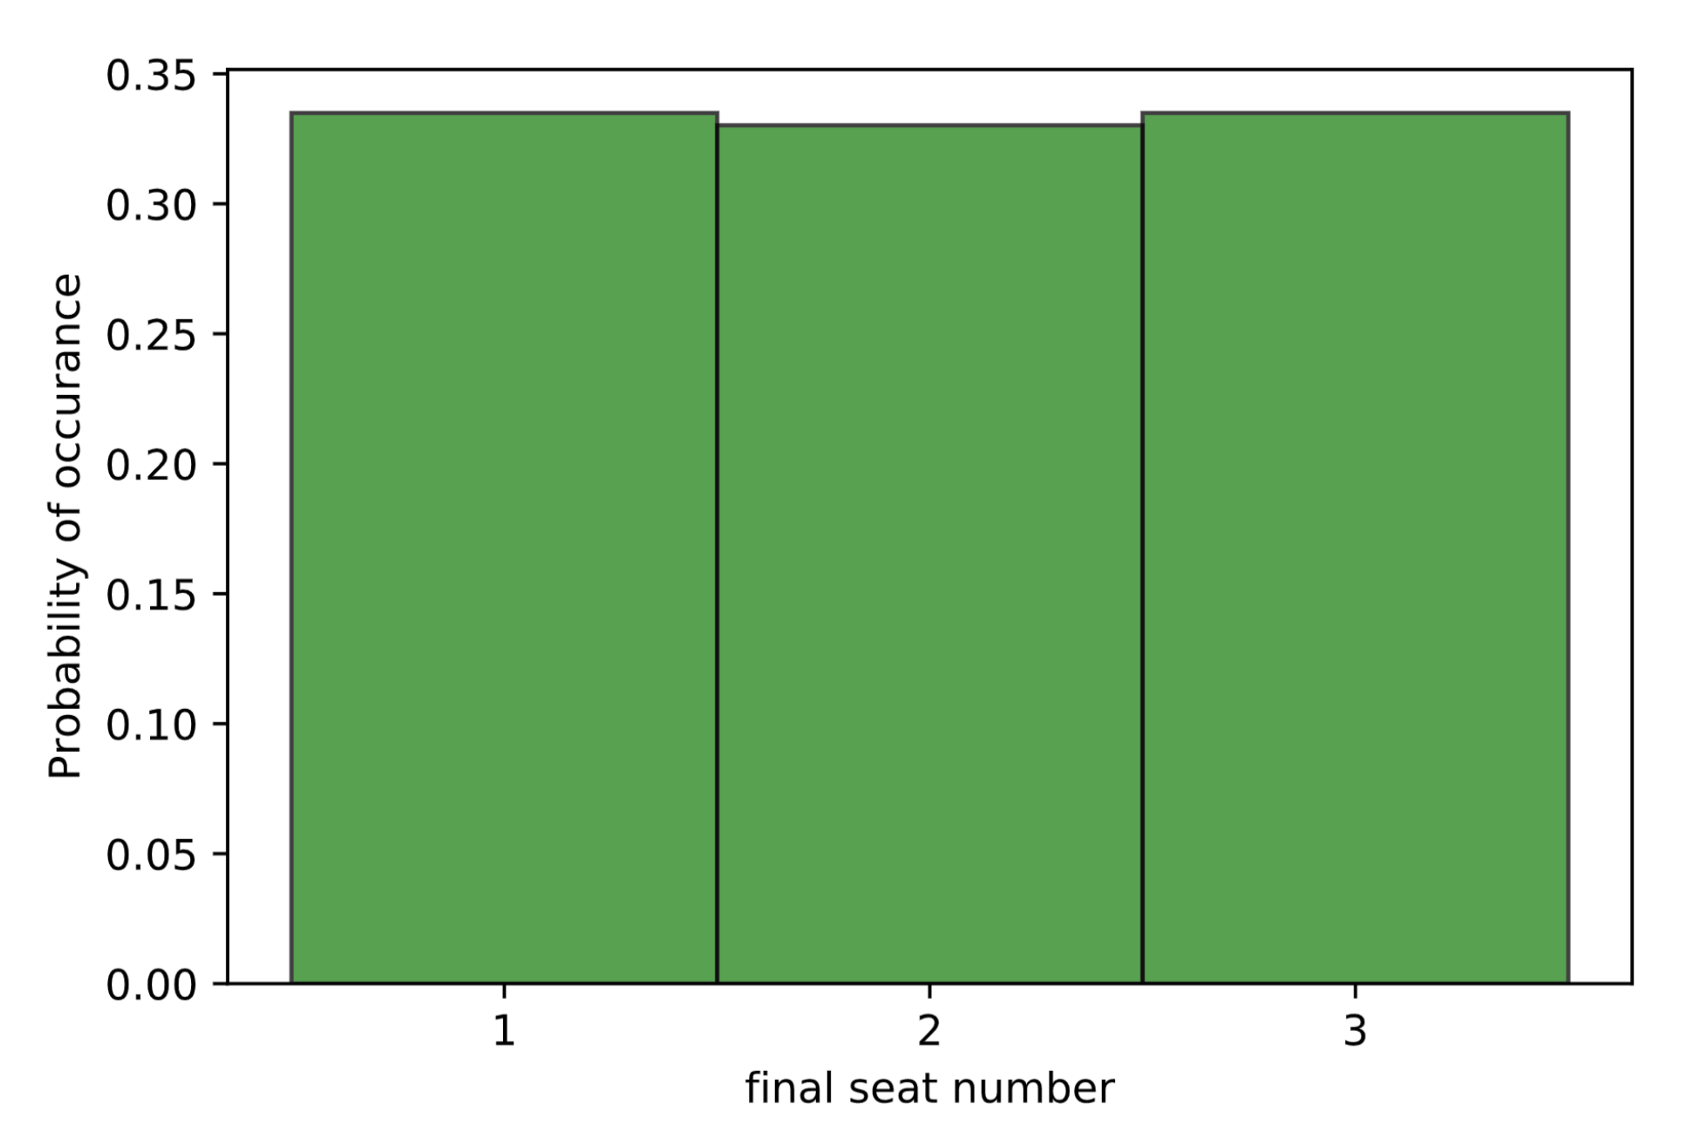
\[\sum_{k=1}^{\infty} 2^{-(k+1)} = \frac{1}{3}\]We can simulate large numbers of such tables and observe a distribution that agrees with the analytical solution shown above. Below is such a simulation, using 106 four person tables, suggesting a probability of 0.334 ± 0.004 for each seat:
While analytical strategies are not readily scalable to large numbers of seats, computer simulations are, and we find similarly flat distributions for 10-, 20-, and 100- person tables:
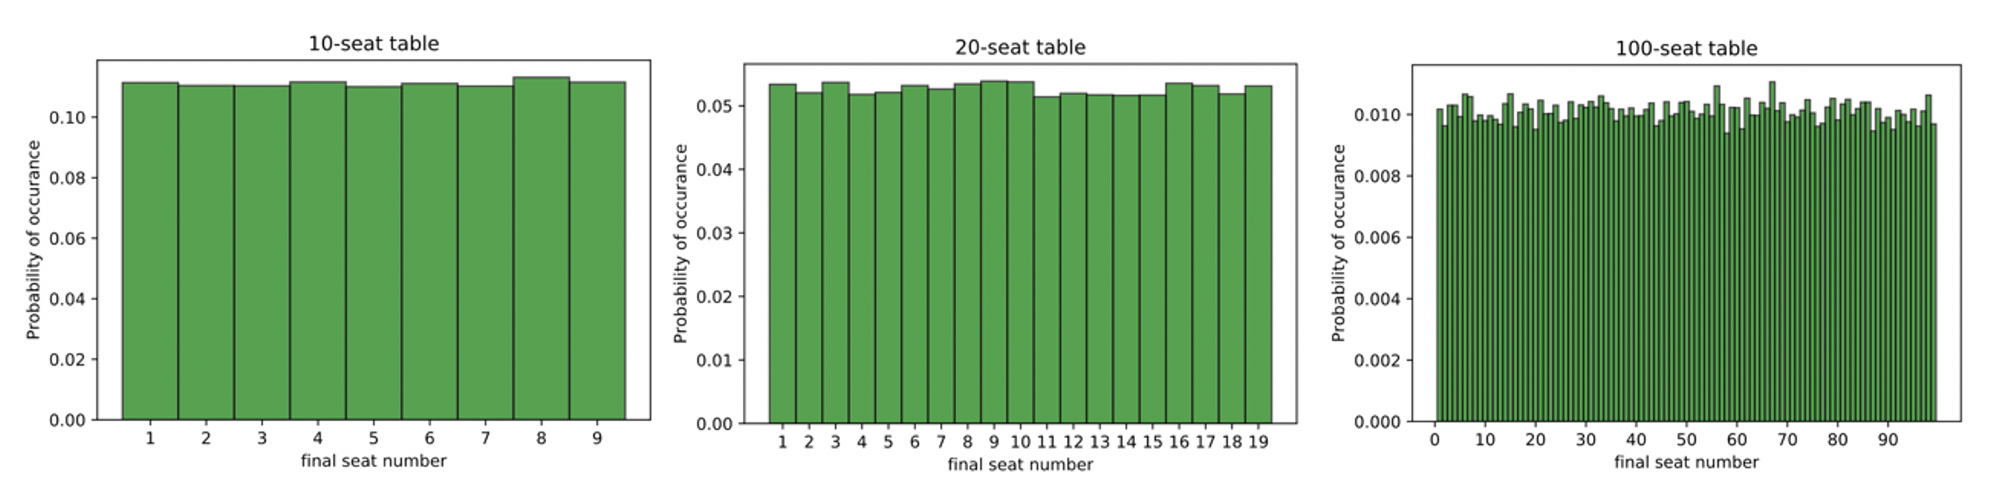
Specifically, our 20 person table (105 simulations) suggests a probability of 0.0529 ± 0.0025 for each seat. This is close agreement for equal probabilities (1/19 = 0.05263) as proposed above. Both the analytical and computational treatments suggest a surprising result: Each seat has an equal probability of being the last to receive the cranberry sauce.